Open Telemetry Collection Pipeline
There are several articles, or thousands probably on the topic of OTEL. I specifically will focus on the data collection infrastructure a bit more since there’s a pretty slick pattern I finally got working.
Basics
Let’s do the quick 101 so we can move on to the fun stuff.
OpenTelemetry (OTel) is an Open Standard for observability and collecting metric, spans, logs, and profiling (quasi-beta)
Metrics: Usually single data points, cpu usage, memory, etc.
Logs: Basically a log of an event happening and any context that goes with it.
Traces: A trace is a sequence of events tied to a request or operations. It can span across multiple services in a distributed system or a variety of code layers till it finally returns a response.
Profiling: I won’t dig much into this but it’s a supported feature. You can read more about it here: https://opentelemetry.io/blog/2024/profiling/
At its more basic simplest state. OTel is way of sending data from your application to an agent/collector that is eventually visualized in someway. In order to do that I’ll start by describing my initial configuration.
- App Layer configured to send data to an agent. This can be done in every language under the sun. I do mean that fairly literally as you can see here.
- APM Server, in my case it’s an elastic derivative: https://www.elastic.co/observability/application-performance-monitoring
This was initial proof of concept which worked out pretty well. There were a few downside we wanted to take into account once we moved to production.
- Rate Limiting: We don’t want a rogue process to go crazy and DoS the service.
- A sane authentication layer, so we need the Bearer Token/Basic auth to be passed along across the various hops to validate the request.
- Bonus points: Ability to write data to various backends and visualization while we do some further explorations.
- Secure of course. APM already has the HTTPS layer + API keys so whatever changes we make needs to at least maintain the same trust.
Rate Limiting
For this I had a choice between nginx and haproxy. (Well, among others but they were the contenders I was considering).
After wasting more time than I care to on trying to figure out an haproxy that was friend to my letsencrypt cert, I decided to go with nginx. It might be supported but I was spending far too much time doing something as simple as load an SSL cert.
Related Issues:
- https://github.com/haproxy/haproxy/issues/221
- https://github.com/haproxy/haproxy/issues/785
I’m also far more familiar with nginx, so it seemed like the better choice.
There’s a few things that are needed. A configuration change and a site config.
Config:
limit_req_zone $http_authorization zone=apm_by_api_key:10m rate=20r/s;You can set this to any value you’d like, but in my case I have it a 10mb buffer and limited the requests to be 20 requests per second which seemed reasonable for my use case.
Site Config:
server {
    # Listen on IPv4 and IPv6 for HTTPS
    listen 443 ssl;
    listen [::]:443 ssl;
    server_name myhost;

    # SSL configuration
    ssl_certificate /etc/letsencrypt/live/myhost/fullchain.pem;
    ssl_certificate_key /etc/letsencrypt/live/myhost/privkey.pem;
    ssl_protocols TLSv1.2 TLSv1.3;

    # Proxy settings
    location / {
        limit_req zone=apm_by_api_key burst=5 nodelay;

        # If the request is rate limited, return 429 Too Many Requests
        limit_req_status 429;

        # Forward to APM Server
        proxy_pass http://localhost:4318;
        proxy_set_header Host $host;
        proxy_set_header X-Real-IP $remote_addr;
        proxy_set_header X-Forwarded-For $proxy_add_x_forwarded_for;
        proxy_set_header X-Forwarded-Proto $scheme;

        # Standard timeouts and buffering settings
        proxy_connect_timeout 30s;
        proxy_send_timeout 60s;
        proxy_read_timeout 60s;
        proxy_buffering on;
        proxy_buffer_size 8k;
        proxy_buffers 8 8k;
    }
}

# Redirect HTTP to HTTPS
server {
    listen 80;
    listen [::]:80;
    server_name {{ item.hostname }};

    return 301 https://$host$request_uri;
}
At this point we are taking any requests received on the server and proxying it to port 4318 on localhost. Any Headers etc are passed on.
If we get too many requests we’ll error out with an error code of 429. The burst simply gives an allowance of 5 extra after you hit your limit.
Now, at this point we could either point it to the local APM server on 8200 or in our case sending the data to the OtelCollector
Collector
Before we get there my biggest issue debugging this was trying to figure out what headers were being passed on or not. I ended up using this minor golang code. It’s not needed but for reference if anyone else finds this useful.
package main

import (
	"fmt"
	"log"
	"net/http"
)

func dumpRequest(w http.ResponseWriter, r *http.Request) {
	fmt.Println("Request Method:", r.Method)
	fmt.Println("Request URL:", r.URL)
	fmt.Println("Request Headers:")
	for k, v := range r.Header {
		fmt.Printf("%s: %v\n", k, v)
	}

	w.WriteHeader(http.StatusOK)
	w.Write([]byte("Request dumped to console"))
}

func main() {
	http.HandleFunc("/", func(w http.ResponseWriter, r *http.Request) {
		dumpRequest(w, r)
	})

	log.Println("Server listening on port 4318")
	log.Fatal(http.ListenAndServe(":4318", nil))
}
It runs on the same port as the collector so you can swap out the services. You can also read / dump the body but in my case it didn’t matter as much.
Okay, on to the Otel Collector. The nicest and slickest thing about the Collector is that you can setup multiple sources of data collection (both push/pull) and you can write out to multiple backends with lots of bells and whistles like extentions, batch processing etc.

You can view your collector config here, to be better visualize it.
It took a little while to figure out the exact mechanics to be able to take the Api Key from the http request and pass it on to the APM server. This is my working configuration.
receivers:
  otlp:
    protocols:
      http:
        endpoint: localhost:4318
        include_metadata: true

extensions:
  headers_setter:
    headers:
      - action: insert
        key: Authorization
        from_context: Authorization

exporters:
  otlp/elastic:
    endpoint: localhost:8200
    tls:
      insecure: true
    auth:
      authenticator: headers_setter


service:
  extensions: [headers_setter]
  pipelines:
    traces:
      receivers: [otlp]
      exporters: [otlp/elastic]
    metrics:
      receivers: [otlp]
      exporters: [otlp/elastic]
    logs:
      receivers: [otlp]
      exporters: [otlp/elastic]
The big caveat was the headers_setters extension and insuring the include_metadata is set to true.
At this point I just needed to change the APM server to make sure it doesn’t listen to 0.0.0.0 and is only bound to localhost
APM Server
Here’s my working configuration:
apm-server:
    # Listen on all addresses
    host: "localhost:8200"

    auth:
        api_key:
            enabled: true
#            limit: 50

logging.level: info
logging.to_files: true
logging.files:
  path: /var/log/apm-server
  name: apm-server
  keepfiles: 7
  permissions: 0640

output.elasticsearch:
    hosts: [ "https://elasticProdHost:9200" ]
    username: "aValidUser"
    password: "SecretPassword"
The api_key limit is the only check I found and it only limits the number of API keys it accepts. It doesn’t seem very useful, but to each their own.
Create API Key
This can be done via the elastic API if you like but it’s far easier to simply log into a running instance of Kabana.
API Keys can be found at: /app/management/security/api_keys
A few limitations I found annoying.
- I can’t seem to re-issue an API Key. I understand not being able to view it, that’s fine. If I need the same config, I need to delete the key and re-create it.
To create a new key just hit new key and I’ve added the following blocks:
Control Security Privileges:
{
  "apm": {
    "cluster": [],
    "indices": [],
    "applications": [
      {
        "application": "apm",
        "privileges": [
          "event:write",
          "config_agent:read"
        ],
        "resources": [
          "*"
        ]
      }
    ],
    "run_as": [],
    "metadata": {},
    "transient_metadata": {
      "enabled": true
    }
  }
}
Additional Meta Data:
{
  "application": "apm"
}
Since every app has a unique API Key we can add more meta data based on the API Key.
Once this is all done we can start consuming data and spanning off our data to all kinds of different backends or visualizations. Here’s a few to get you started:
Future Improvements
I might consider running the collector in a docker-compose stack or simply running several instances of it. It’s still a single instance. I would also like to see about completely ripping the APM server out of the equation to see how pure elastic visuals work.
My ideal config would be nginx → multiple collectors with some LB pattern (Round robin etc) → multiple exports and routing as needed.
Granted my use case is pretty simple, if you need to scale this you’d want more than a single host for your entry point.
Final Note
One thing to keep in mind is that while initially I was using the APM Cluster directly the ingest change was enough that the same URLs wouldn’t work.
I was using the OTEL collector to ship data as well, so I needed to change my configuration a bit.
  otlphttp:
    endpoint: https://somehost:443
    tls:
      insecure: false
    headers:
      Authorization: "ApiKey SECRET"
  otlp/elastic:
    endpoint: somehost:8200
    tls:
      insecure: false
    headers:
      Authorization: "ApiKey SECRET"
I basically needed to transition from using otlp/elastic to using otlphttp. Yet another reason why using collector is neat. It’s maybe 5 lines of code make the change and presto.
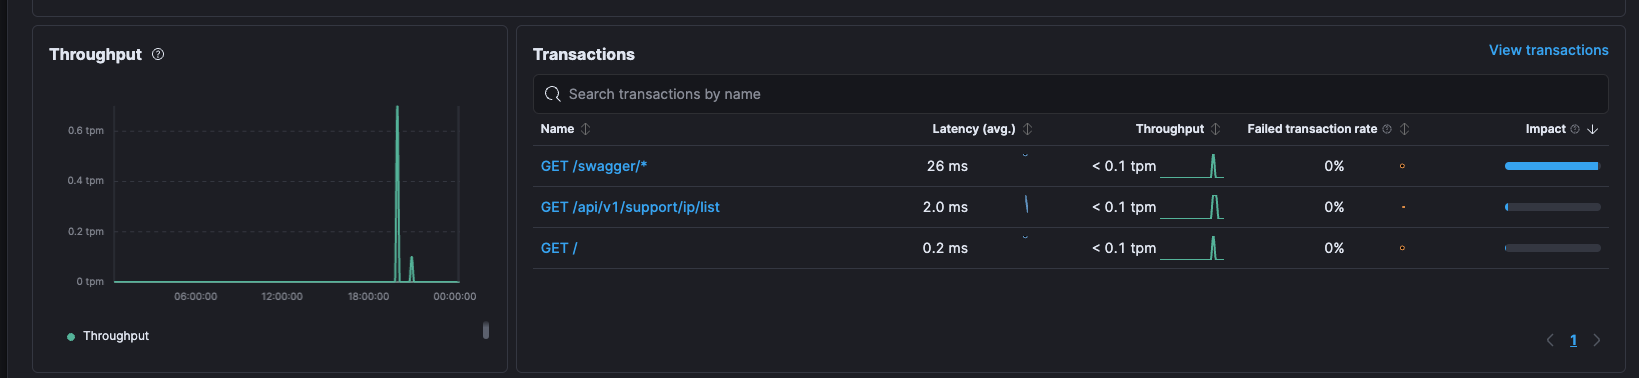
Now my pretty shiny visualizations show up on Kibana. Next is finding the right tool to view all these lovely telemetric measurements.